


Jesse Rosen, AbelCine's Director of Technical Development, designed the charts, beginning with extensive research on what to measure, the many patterns and designs to consider, and evaluating what worked and what didn't.
Many of our specialists and rental technicians spoke with AbelCine clients and personnel to gather their opinions and input on what should be included in the new charts, and continued to check in every few weeks throughout the process. The result is a fantastic new focus chart we think our clients will love using.
Our previous focus charts relied on the Siemens Star pattern, which doesn't show a clearly visible difference between resolved and unresolved frequencies. Many digital cameras will show some amount of aliasing on fine detail, which makes it even harder to judge focus with a Siemens Star, because you can end up with false detail created by the aliasing. Furthermore, with many lenses on digital cameras there will be slight differences on the focus barrel between the point of maximum MTF of lower spatial frequencies and maximum MTF of higher spatial frequencies, or between different colors, all of which is very hard to discern with the star pattern.
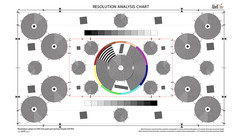
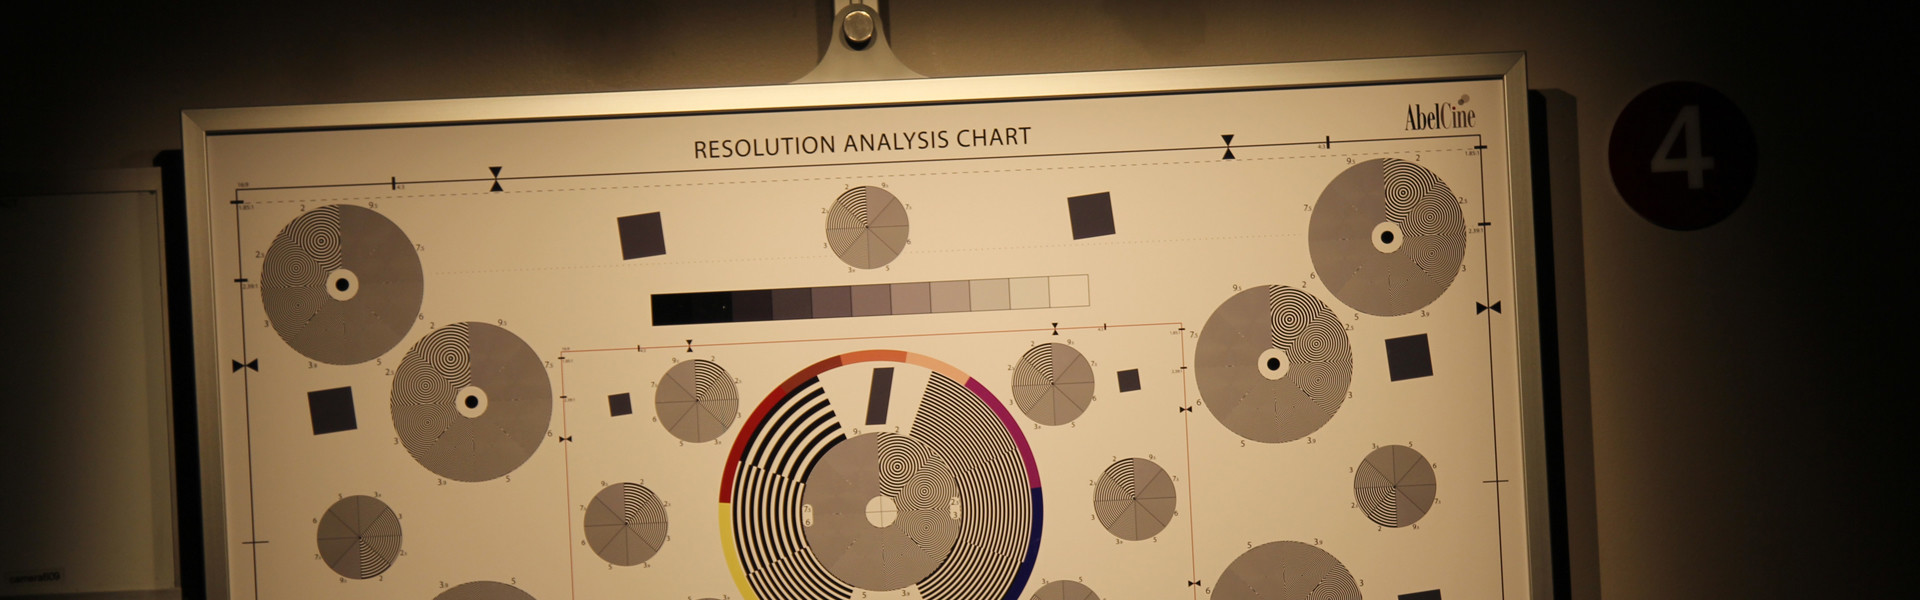
To overcome this, the new charts feature test targets of concentric circles -- each circle's design corresponds to specific line pairs per picture height measurements when the chart is framed to fill the screen. It's much easier to achieve an accurate reading with these circles as they virtually snap into focus. Because the circles represent specific, single frequencies, it's possible to easily see the point of maximum resolution and how focus affects the contrast of different frequencies, as well as how lens and camera combinations can affect MTF.
A second set of circles, within a set of smaller frame lines, makes it possible to test focus with a telephoto lens when your current space won't allow you to move far enough from the chart to frame the outer set of frame lines. The chart supports all popular aspect ratios, and has a symmetrical design to allow for analysis of resolution across different areas of the frame. The charts also include an 11-step gray scale and a six-color wheel, which includes six primary and secondary colors for accurate camera matching and LUT creation. The six colors correspond to the six axes on a vectorscope.
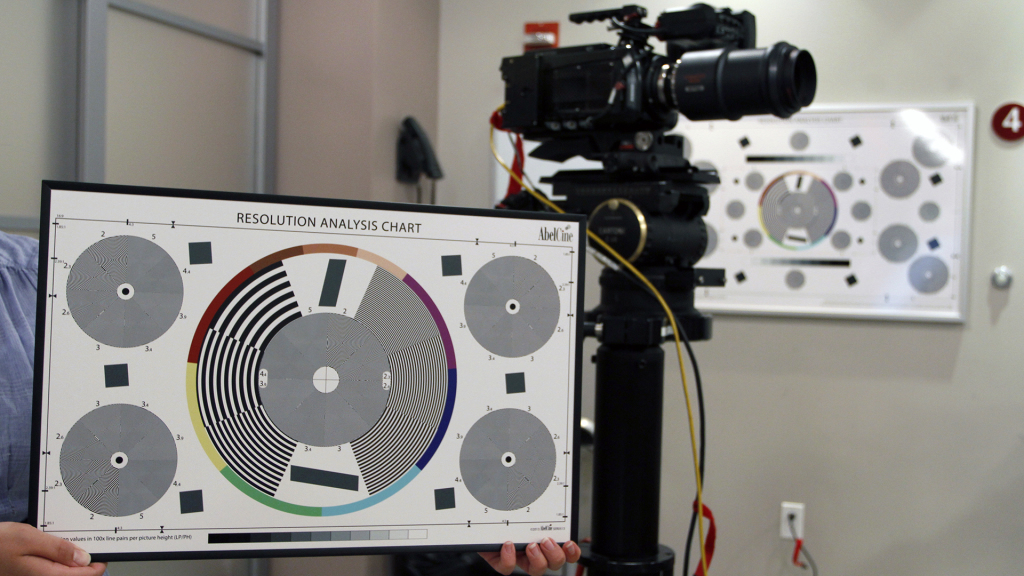
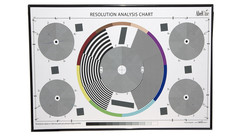
Resolution Analysis Chart with 40" Chart in the background
Before NAB, when we began to show the final design to ACs and other clients, we received such positive feedback that Jesse and his Engineering team immediately went to work on two smaller sizes. We ended up with a family of three resolution charts - a 40" Resolution Analysis Chart, a 20" Resolution Analysis Chart, and a Focus Bowtie Chart - that cover the gamut of uses, from rental houses, to production companies, to use out in the field.
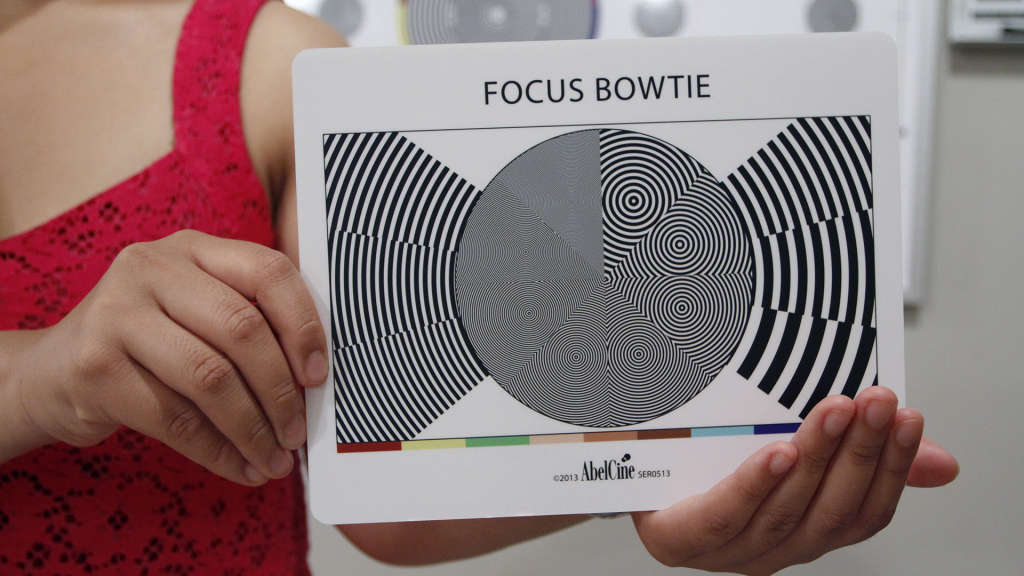
Focus Bowtie Chart
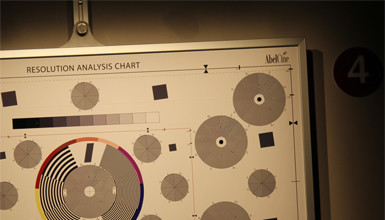
The 40" Resolution Analysis Charts are now installed in our Burbank and New York rental facilities. To learn even more about them, read Jesse's white paper and FAQ, then check out this great interview shot by our friends over at Studio Daily in our NAB booth. Plus, if you'll be attending Cine Gear, make sure to stop by Booth #S225 to see some of our charts up close!