


Jesse Rosen, AbelCine's Director of Technical Development, designed the charts, beginning with extensive research on what to measure, the many patterns and designs to consider, and evaluating what worked and what didn't.
You can download the white paper here or read the entire white paper below.
A New Camera and Lens Analysis Chart
Jesse Rosen
Director of Technical Development, AbelCine
Over the past couple of years at AbelCine, we've grown increasingly aware of the shortcomings of the charts used in many rental checkout bays throughout the industry, including our own. Lenses being prepped by camera assistants were regularly being sent back to service to check back focus, only to discover that the lens was fine. In many cases, it was just too hard for camera assistants to consistently see focus accurately with the star pattern on the chart we provided.
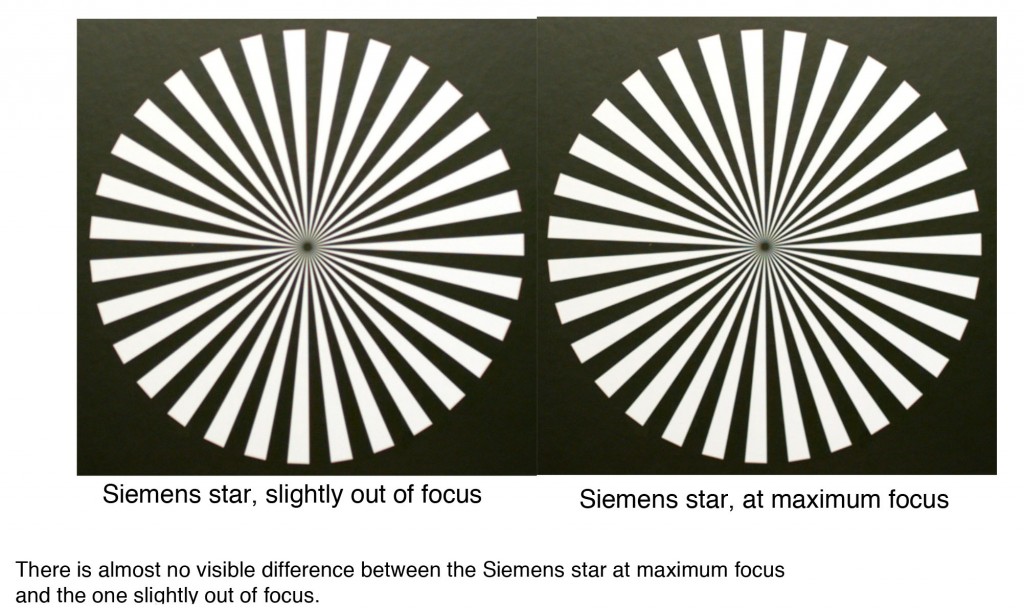
There are a few reasons why this occurs with standard focus charts. A star pattern presents a linear, continuous progression of spatial frequencies. Theoretically, it should be a simple matter to perceive the point of maximum sharpness of a lens, as any point closer to the center of the pattern than the maximum resolvable frequency should be unresolved.
However, there are several effects that make this more difficult than it seems.
First off, there is not a clearly visible delineation between resolved and unresolved frequencies, as there is decreasing MTF as detail progresses from low to high frequencies. The highest frequencies resolvable will have such low MTF that they are barely discernible. Additionally, most of today's digital cameras will show some degree of aliasing on fine detail. This further confounds the reading of the Siemens star, as there will, in essence, be "false" detail visible beyond the point of maximum resolution of the system. This all adds up to a condition where small, but significant changes in focus can be made with almost no noticeable change to the pattern.
To counter these effects, we decided to design our own chart, and came up with the following list of requirements:
- It must be easy to see focus, and sensitive to small changes in focus.
- It must be able to discern focus easily across a wide range of scales and focal lengths, such as on the long and wide ends of a zoom lens for checking back focus.
- It must be useful for detecting camera and lens issues other than center focus, such as differences in sharpness between the center and edges of the frame, and between one side of the frame and the other.
- It must offer objective measurements that are easy to determine and not dependent on measuring the distance between the chart and focus plane.
- It must provide features for MTF analysis of a camera image.
- It must provide color and greyscale features for detecting camera problems or errors in setup.
- It must provide markings for the most commonly used aspect ratios.
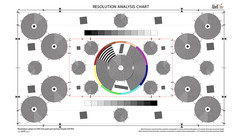
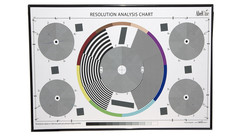
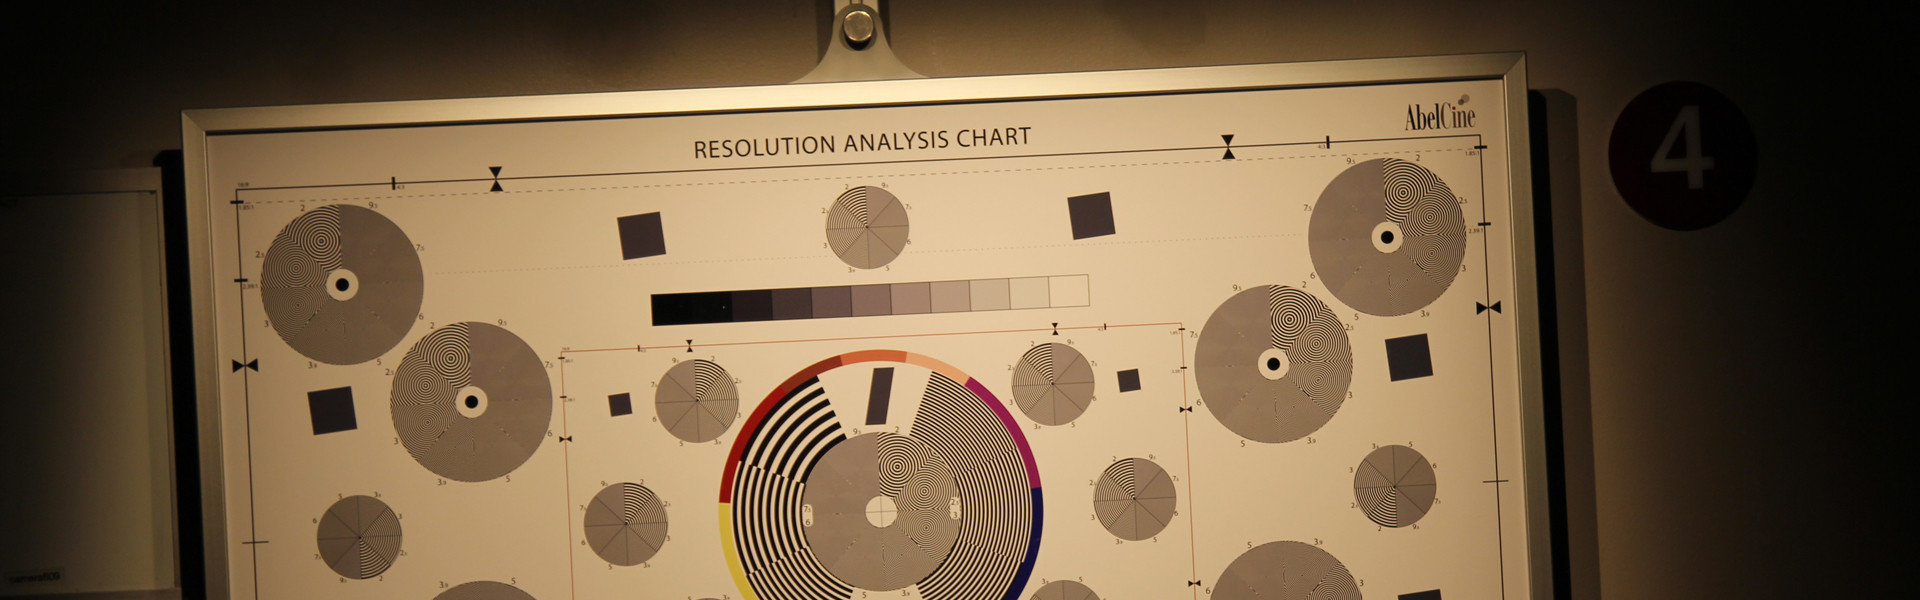
After a period of analysis and testing, we finalized the design of the new AbelCine Resolution Analysis Chart, incorporating the following design elements.
- Discrete Frequencies -- For any frequency represented, it is a simple matter to determine if a frequency is fully resolved, aliased, or not resolved.
- Logarithmic Progression of Frequencies -- The differences between successive frequencies is spread out to make a sharper boundary between resolved and unresolved frequencies for the entire range of frequencies depicted in the chart. This also allows the chart to be usable for a wide range of camera/system resolutions -from NTSC to 4K.
- Circular Patterns -- to reveal differences in resolution across different axes. For cameras that don't have square pixels in either the sensor or recording format, it is possible to determine the effect of resolution independently for each vector.
- Frame Relative Units of Measurement -- All resolution measurements are printed in frame-relative units of Line Pairs per Picture Height (LP/PH), so no knowledge of the camera's sensor dimensions is needed to get readings that can be compared to readings from a different sensor. Furthermore, it is not necessary to measure the distance between the camera's focus plane and the chart, or know the precise lens focal length to get accurate readings; it is only necessary to visually align the frame markers on the chart to the edges of the camera's recorded frame.
- Pattern Symmetry -- The resolution pattern is repeated throughout the frame to enable comparisons of optical performance of different areas of the recorded image. The patterns are rotated and reflected to provide radial symmetry of the patterns, making lens evaluation more precise and meaningful.
- Situational Flexibility -- Smaller patterns provide additional resolution readings where there is no room on the chart for the full pattern. Half size frame lines in the center of the chart enable taking measurements using telephoto lenses in a limited space.
- Multiple Aspect Ratios -- While the main frame lines of the chart are in a 16:9 aspect ratio, alternative frame lines provide markings for other common aspect ratios of 4:3, 1.85:1 and 2.39:1.
- MTF Analysis Support -- Slanted edges (sharp transition between dark grey and white) to provide targets for MTF analysis in software such as Imatest. (For a technical explanation of this process, see http://dougkerr.net/Pumpkin/articles/MTF_Slant_Edge.pdf)
- Colors and Greyscale -- The colors around the center pattern correspond to the six primary and secondary axes on a vector scope, plus skin tones. Greyscales on the top and bottom of the chart present a progression of swatches increasing in density with a gamma of 2.2. These features are primarily intended to reveal gross errors in camera setup, but they can also be used for matching cameras.
 Usage Scenarios


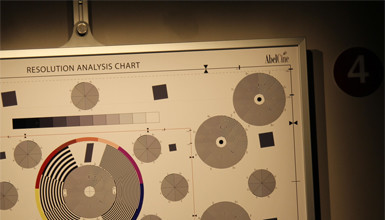
Set Up
In all usage situations, the chart should be evenly lit, brightly enough for the desired lens aperture setting to be used for testing. For critical measurements, particularly when using wider angle lenses, it is important to ensure that the chart is being photographed squarely. A method for achieving this is to affix a mirror to the center of the chart, then position the camera so that the reflection of the center of the lens is visible in the center of the image.
Lens / Camera Sharpness Comparison
Frame the chart so that the outer frame lines exactly mark the edges of the recorded frame. Examine the patterns throughout the frame. The finest clearly discernible pattern with no aliasing represents the resolution of the system for that part of the frame. All measurements are in hundreds of Line Pairs per Picture Height (LP/PH).
When it is impossible to gain sufficient distance from the chart to incorporate the entire pattern (e.g. when testing with a telephoto lens), frame to the inner frame lines instead. To get the resolution measurement, multiply the number of the finest resolved pattern by 50.
Setting Back Focus on a Video Lens
Set up the camera at a distance from the chart whereby, at the most telephoto portion of the lens, enough of the higher frequency patterns in the center of the chart are visible to clearly set focus on the lens. Then zoom to the widest end of the lens and change the back focus adjustment on the lens. Best focus should be clearly visible by examining the coarser patterns surrounding the center of the chart.