


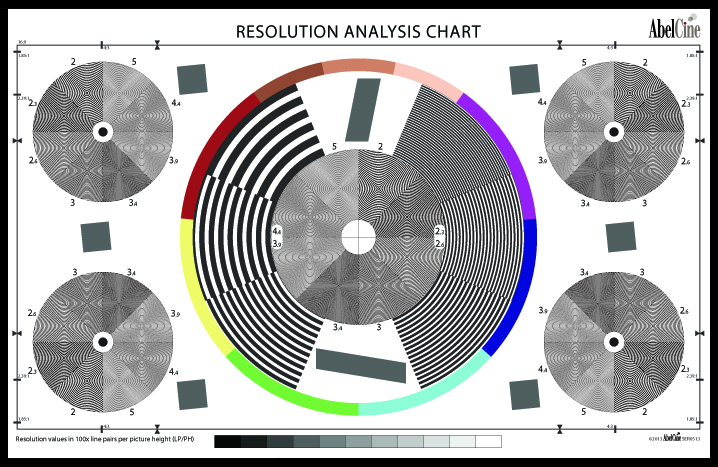
Q: In order to see best focus, which areas of the chart should I be looking at when I am focusing the lens on my camera?
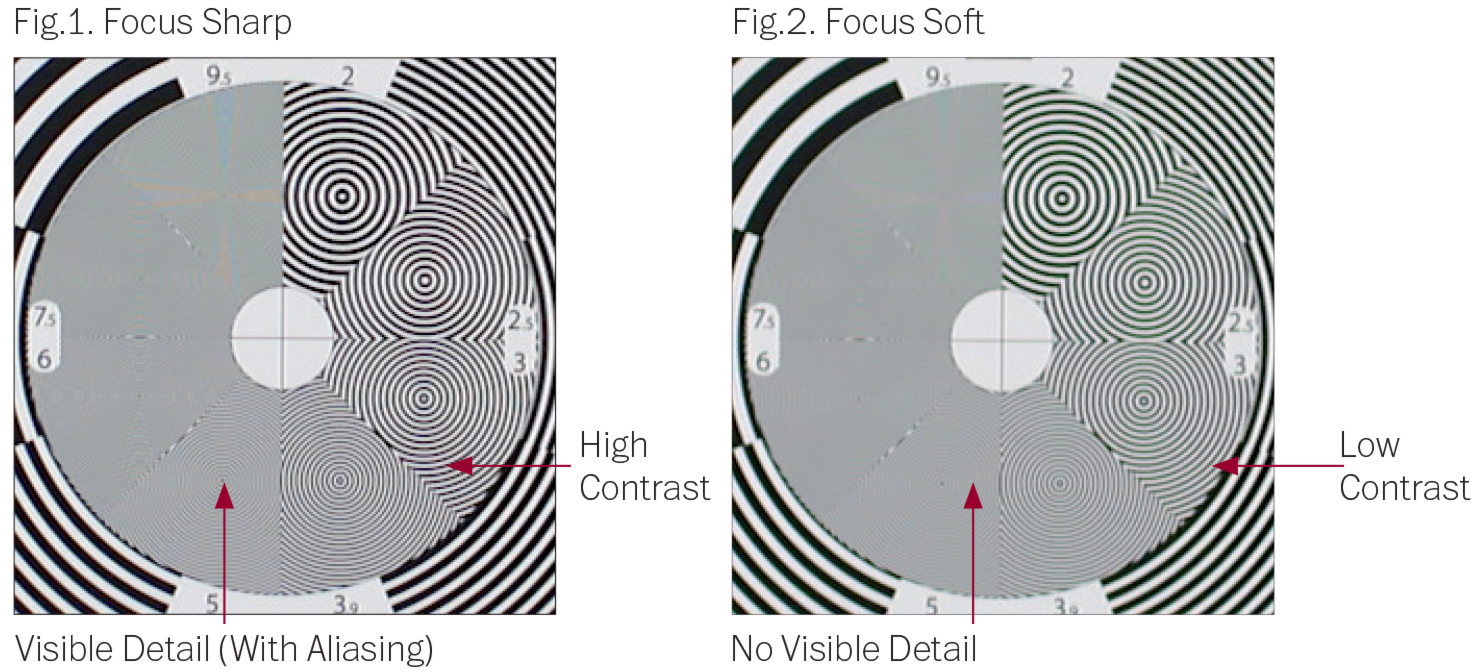
A: When the lens is optimally focused, you will see high contrast in low to medium spatial frequencies (i.e. where there are larger features in the image), maximum detail in higher frequencies (i.e. in finer features), as well as minimum chromatic artifacts (i.e. false color). All of these aspects can be observed individually on the chart. Start by looking at the patterns representing lower frequencies (exactly which patterns will depend on the resolution of the camera and lens, as well as the size of the pattern relative to the frame). As you rotate the focus barrel on the lens, the coarser patterns will increase in sharpness and contrast. You may see a slight shift in color when you pass the point of maximum focus. To achieve fine focus, you may need to engage the image zoom function of your camera and/or monitor. Slowly change the focus on the lens while looking at the finest pattern that shows any detail, and find the point that exhibits maximum sharpness in the finest visible pattern.
Note that sometimes not all of these qualities will be at their best at the same point on the lens. Our sense of sharpness is heavily influenced by the contrast of an image. Therefore, it is generally best to favor the point where there is the highest contrast and least amount of color fringing in the image, as these images will look the sharpest.
Q: What if I'm using a zoom lens? Do I look at the same pattern at the wide end of the lens as the long end?
A: No, as you zoom the lens and the features of the chart change size in the frame, you will need to look at different patterns. At the wide end of the lens, you will see focus with the larger patterns in the chart, and the finer ones will probably be too small to resolve any detail. When you zoom in, you will need to shift to look at the finer patterns to best see focus.
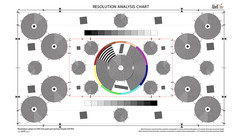
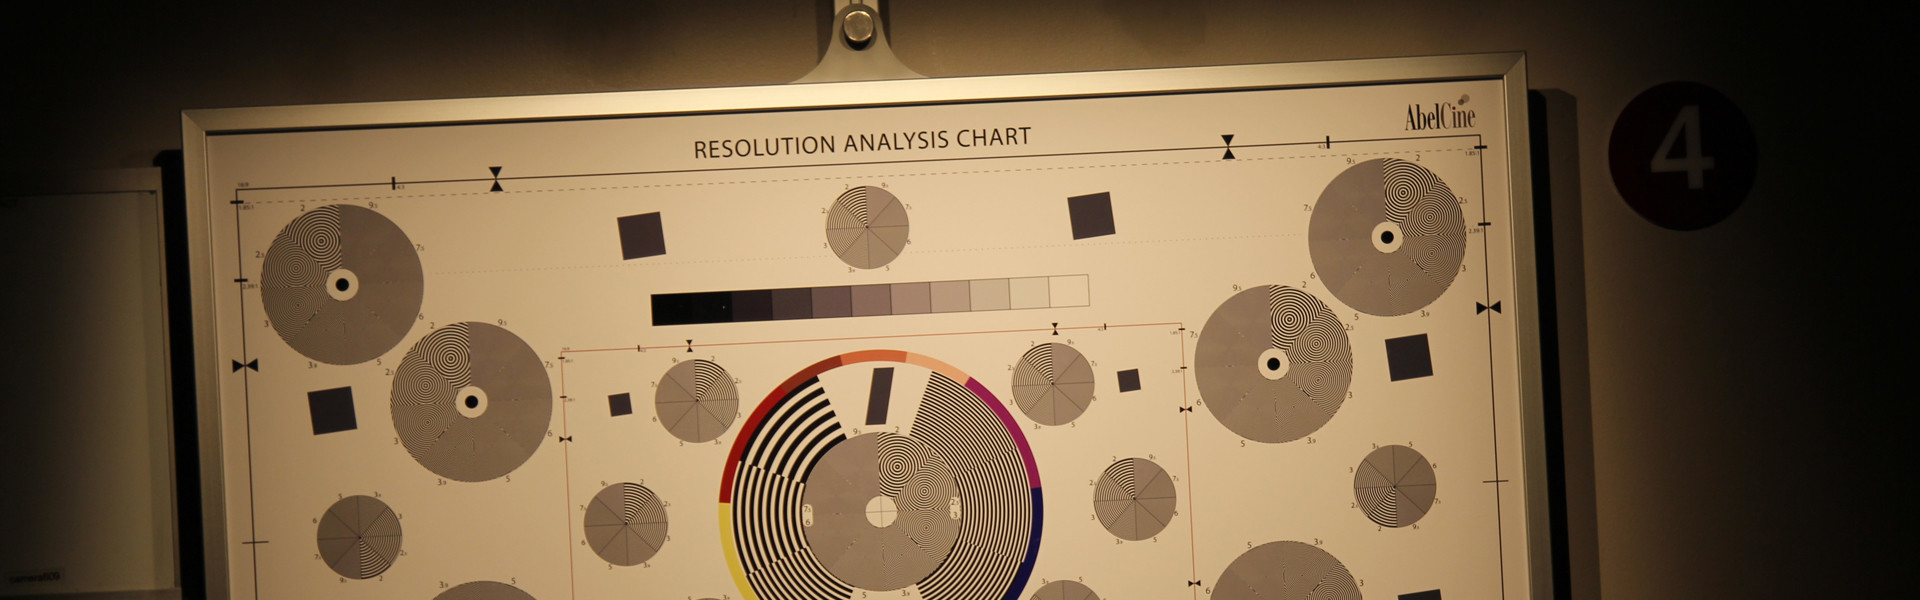
Resolution Chart: Click image to view larger
Q: That seems confusing. Wouldn't I be better off with a Siemens star?
A: While a Siemens star seems simple, it is not nearly as precise in terms of actually showing focus. The optical effects of a lens and camera at and near the point of best focus -- aliasing, chromatic aberration and variable contrast of different frequencies of detail -- act to obscure fine changes in focus.
The patterns on the Resolution Analysis Chart, by displaying only discrete frequencies, are much easier to read. It is a simple matter to see which frequencies are resolving and which are aliasing regardless of chromatic artifacts or the contrast of the lens.
Q: I've heard that there's a difference between "sharpness" and "resolution" -- that the point where I find maximum contrast on the focus barrel of my lens may be different from where I find the most detail, or something similar. What's up with that, and can I see this phenomenon on the Resolution Analysis Chart?
A: What we perceive as sharpness has more to do with the contrast of the edges we see than with resolution (which is how fine the detail is that we can discern). Fortunately, these imaging aspects can be observed individually using the chart. The resolution of the imaging system can be determined by observing the finest resolution pattern that can be accurately reproduced. The overall sharpness of the image can best be seen by looking at the contrast of the coarser resolution patterns in the image (i.e. how dark the circles are, and how bright the spaces between them are), as well as how sharp the edges themselves are.
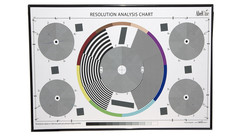
Click to view larger
Q: What do the numbers on the chart mean?
A: The numbers for each resolution pattern are resolution measurements in hundreds of line-pairs per picture height. That means that the width of the lines in the "5" pattern is exactly 1/1000 of the total distance between the top and bottom frame lines, so that 1000 lines (or 500 line pairs) would fit in the frame. This is a convenient resolution measurement, because it is relative to the final frame size, so comparison of measurements between dissimilar cameras is meaningful.
Q: What is MTF?
A: The Modulation Transfer Function, or MTF, is a mathematical function that combines resolution and contrast into a single measurement, and closely correlates with the perceived sharpness of an image. MTF essentially represents the maximum possible contrast in an image for features of a specific size (or frequency) in the image. By graphing MTF over a range of frequencies (conventionally drawn with the vertical axis representing MTF and the horizontal axis representing frequency) it is possible to represent the perceived sharpness of an imaging system. The MTF of lower frequencies (i.e. coarser detail) is always higher in an image than higher frequencies, so the graph of MTF will look like a downward sloping line or curve.
Q: What are the slanted squares used for, and how?
A: The edges of the slanted squares around the chart can be used to plot a full MTF curve of the imaging system for each edge that is analyzed. Some programs that can be used are Imatest and QuickMTF. For a technical explanation of the technique, check out this article by Doug Kerr.
Q: Why are the slanted squares grey and not black? How should they be exposed?
A: The MTF analysis works by analyzing the transition from a dark shade to a light shade. Because cameras often use gamma curves that have non-linear portions towards the extremes (perhaps darkening the shadows to increase contrast, or compressing the light areas to contain more highlight detail), analysis of a transition that includes shades that are affected in one of these ways will result in a distorted MTF curve, reflecting as much the color processing of the camera as the basic performance of the sensor and lens. By exposing the chart so that the square is dark gray and the white background is a lighter gray, a more neutral MTF analysis will result.
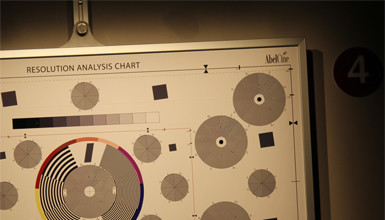
Q: I'm worried that my lenses might have a problem. Is it normal that the corners of the image are softer than the center, or that the corners of the image seem to focus at a different plane than the center?

Color Fringing caused by Chromatic Aberration
A: The AbelCine Resolution Analysis Chart is designed to show many critical lens characteristics in a way that is very easy to understand visually. As you begin to use this tool, you may be distressed to see artifacts and aberrations in even the highest quality lens. Don't worry! The chart generally shows optics at their worst so that you can distinguish subtle differences between lenses. Consider the following:
- Most lenses will demonstrate less resolution and more chromatic aberrations in the corners of the image than in the center. You may also find, especially with wide angle lenses, that the field of focus is curved. This will make the corners look even worse than they might appear in an actual scene.
- Try setting focus for the corners of the image rather than the center -- you may find best focus at a different point. Remember that you probably won't be filming flat surfaces very often in your productions!
- Chromatic artifacts will be most noticeable when shooting a black and white pattern. What looks obvious on the chart might not be as noticeable in a real-world situation.
- Aliasing that is obvious on a focus pattern may be absent or subtler on most real-world content.
Q: Does the chart have an expiration date?
A: No. The AbelCine Resolution Analysis Charts are manufactured with archival-quality materials. When stored in a cool, dark place the chart will last indefinitely. By minimizing its exposure to heat, humidity and light with high ultraviolet content (such as direct sunlight), the AbelCine Resolution Analysis Chart should last for years with careful use.